
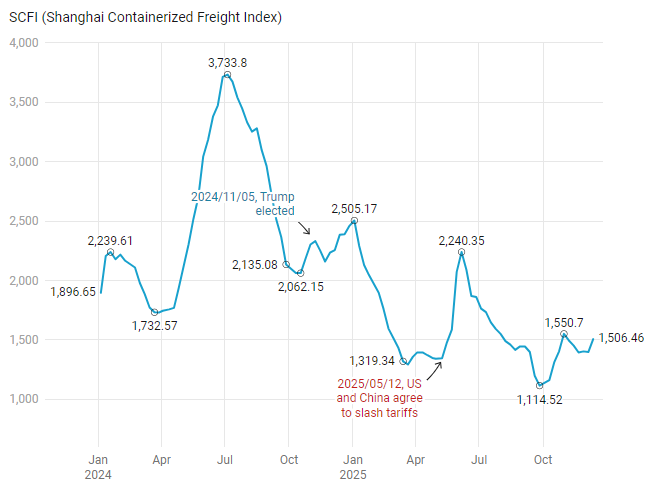
The SCFI (Shanghai Containerized Freight Index) data presented on this page is based on official figures published by the Shanghai Shipping Exchange (SSE).
The market analysis and commentary reference and excerpt information from the Korea Ocean Business Corporation (KOBC) Weekly Integrated Report. Relevant news articles and posts on 𝕏 have also been used as supplementary sources.
2025/12/26📈 1552.92→1656.32(+103.4), up 6.7% from the previous week
2025/12/19📈 1506.46→1552.92(+46.45), up 3.0% from the previous week
The rate increases implemented on December 15 continued to hold. Major trades to North America, the Mediterranean, and the Middle East recorded gains, while rates to Europe, Africa, and South America remained under downward pressure.
The Premier Alliance announced its 2026 fleet deployment plan. Its key strategies include strengthening direct calls to Southeast Asia, reducing the number of port calls on long-haul services, and expanding feeder connections, based on the assumption that routing via the Cape of Good Hope will remain the primary operating pattern.
The global container fleet grew by 7.3% year-on-year in 2025, reaching approximately 33.2 million TEU. Deployment of large newbuildings, previously concentrated mainly on European and North American trades, is becoming more diversified across Africa, India and the Middle East, and Europe.
Weakness on the North American trades is increasingly being offset by growth on emerging-market routes, suggesting that the center of growth is gradually shifting toward emerging markets.
2025/12/12📈 1397.63→1506.46(+108.83), up 7.8% from the previous week
North American and European trades showed a short-term rebound, while other medium- and long-haul trades, including South America and Africa, remained generally weak.
Global container volumes had maintained growth in the 4% range through much of 2025, but growth slowed to 2.1% in October.
With the market entering the fourth-quarter off-season and facing a high comparison base from strong demand in the fourth quarter of the previous year, the slowdown in volume growth is expected to continue for the time being.
2025/12/05📉 1403.13→1397.63(-5.5), down 0.4% from the previous week
Despite an overall slowdown in demand on the U.S. trades, carriers have maintained freight rates above the USD 1,500 level through active capacity management.
Amid U.S.–China trade tensions, container volumes from Vietnam to the United States have remained strong, prompting further restructuring of trade routes and service networks.
Despite weakness in China’s domestic economy, intra-Asia freight markets have remained relatively stable, supported by increased alternative exports through Southeast Asia.
2025/11/28📈 1393.56→1403.13(+9.57), up 0.7% from the previous week
The U.S. trades remained generally weak as sluggish demand persisted despite capacity reductions by major shipping alliances. There were few clear factors capable of triggering a near-term market reversal, and carriers continued to defend freight rates through vessel capacity management amid broadly slowing demand.
The market outlook also remained conservative.
Drewry expected weakness on the North American trades to continue through the first quarter of the following year. Moody’s projected that North American container volumes could decline by approximately 0–2% year-on-year in 2026, while J.P. Morgan also highlighted the possibility of lower freight rates in 2026–2027.
In contrast, intra-Asia trades were expected to remain relatively strong.
An early peak season ahead of the Lunar New Year holiday on February 17, combined with tight capacity, was expected to keep freight rates elevated through January. In particular, China–Southeast Asia freight rates had already reached their highest levels in several months.
With the year-end peak season extending into the pre-Lunar New Year shipping period, the upward trend was expected to continue over the medium term.
2025/11/21📉 1451.38→1393.56(-57.82), down 4.0% from the previous week
The November rate increases were given back earlier than expected, bringing the SCFI back to October levels. Freight rates declined across most trades except Asia and the Mediterranean.
U.S.-bound demand was expected to remain weak through March of the following year, while major economic indicators were also running below historical levels. In particular, holiday-season retail sales growth was estimated at 3.2%, below the previous year’s 4.8%.
Continued deliveries of new vessels were adding further downward pressure on freight rates. Capacity to Northern Europe was expected to reach a record 1.12 million TEU in December, followed by another record of 1.17 million TEU in January.
2025/11/14📉 1495.1→1451.38(-43.72), down 2.9% from the previous week
Medium- and long-haul trades to North America, Central and South America, and Africa weakened simultaneously under the combined pressure of excess capacity and seasonal low demand.
The National Retail Federation (NRF) forecast that U.S. import volumes in November and December would decline by 14.4% and 19.9% year-on-year, respectively.
Weakening consumer sentiment and the front-loading rush during the first half of the year were weighing on second-half cargo volumes, with monthly imports expected to remain below 2 million TEU through March of the following year.
2025/11/07📉 1550.7→1495.1(-55.59), down 3.6% from the previous week
The impact of the November GRI weakened after only one week, leading freight rates lower.
With demand failing to provide sufficient support and capacity increasing slightly compared with October, both the North American and European trades softened.
With no clear catalyst for a near-term rebound in demand, carriers were expected to continue attempting freight-rate increases through capacity management.
2025/10/31📈 1403.46→1550.7(+147.24), up 10.5% from the previous week
The United States and China announced measures to improve their trade relationship during the APEC meetings in Gyeongju, including a suspension of port fees, reductions in fentanyl-related tariffs, and easing of export controls on strategic materials.
By the second week of the newly imposed port-fee regime, estimated charges on carriers such as COSCO and Matson ranged from tens of millions to potentially much higher amounts, creating significant uncertainty. The latest agreement, however, suspended the measures for one year.
Although the trading environment became somewhat more stable, the effective tariff reduction was limited to around 10 percentage points, making a broad-based rebound in demand unlikely.
2025/10/24📈 1310.32→1403.46(+93.13), up 7.1% from the previous week
Because the rebound occurred without a corresponding recovery in demand, there remains a possibility that the market will repeat a pattern of temporary rate increases followed by renewed declines. Carriers are therefore expected to continue reducing capacity.
Port throughput trends in China and the United States showed contrasting patterns. Chinese ports remained strong, with Shanghai up 13.6% and Ningbo up 11.7%, while U.S. ports weakened, including Los Angeles at -7.5% and Seattle at -13.6%.
The divergence reflects slower U.S. imports due to tariff pressures, while China has successfully diversified exports toward destinations including Asia and Africa.
2025/10/18📣 The IMO decided to postpone the adoption decision on the Net-Zero Framework related to carbon pricing for one year.
IMO 𝕏 Post
2025/10/17📈 1160.42→1310.32(+149.9), up 12.9% from the previous week
Following China’s National Day holiday, factories across Asia resumed operations and retailer orders increased, pushing spot freight rates to the U.S. West Coast sharply higher from approximately USD 1,300 per FEU to around USD 2,000 per FEU.
Industry participants expected the rate increase to weaken again within one to two weeks, while carriers announced plans for additional GRIs in November.
2025/10/10📈 1114.52→1160.42(+45.91), up 4.1% from two weeks earlier
The National Retail Federation expected U.S. import volumes from October through February of the following year to decline by an average of around 16%.
The early end of the peak season following front-loading, combined with uncertainty surrounding new tariffs, continued to discourage importers and weaken demand.
In particular, U.S.-bound cargo from China declined 4.8% month-on-month and 11% year-on-year in August. The recently announced additional 100% tariff increase on Chinese products was expected to further weaken demand for shipments originating from China.
2025/10/03📣 No SCFI was published due to China’s National Day holiday.
2025/09/26📉 1198.21→1114.52(-83.7), down 7.0% from the previous week
Earlier front-loading resulted in the disappearance of the usual pre-National Day cargo rush, causing freight rates to decline across all trades except the Far East.
Carriers announced blank sailings on Asia–North America and Asia–Europe services in response to weaker demand around China’s National Day holiday in an effort to defend spot rates. Nevertheless, sharp declines on Asia–U.S. West Coast, Asia–U.S. East Coast, Asia–Europe, and Asia–Mediterranean routes intensified overall market weakness.
Against a backdrop of weaker demand and excess capacity, more than 1 million TEU of additional newbuilding capacity was expected to enter the market before year-end.
2025/09/19📉 1398.11→1198.21(-199.9), down 14.3% from the previous week
Ahead of China’s National Day holiday in October, weaker-than-usual demand and excess capacity intensified competition among carriers, resulting in lower freight rates across all trades except intra-Asia.
Demand for Europe normally strengthens during August and September, but urgent and front-loaded shipments declined earlier than usual this year.
Although carriers attempted to manage supply by reducing capacity, difficulty securing sufficient cargo made freight-rate defense increasingly challenging.
Meanwhile, U.S. tariff policies continued to shift supply chains away from China toward major Southeast Asian countries, providing additional support to intra-Asia container volumes.
2025/09/12📉 1444.44→1398.11(-46.32), down 3.2% from the previous week
U.S. trades increased for a second consecutive week, while European trades continued to decline.
Vessel redeployment increased ahead of U.S. port fees on Chinese-built vessels scheduled to take effect in mid-October.
On the Asia–Europe trade, the early end of the peak season coincided with the large-scale introduction of new ultra-large container vessels scheduled through year-end, resulting in a combination of weaker demand and excess capacity that drove European freight rates sharply lower.
Global carriers’ share of the intra-Asia market had increased to 28%, compared with 20% in 2022. Maersk and Hapag-Lloyd were particularly aggressive in expanding their presence, with capacity increasing by 52% and 97%, respectively.
2025/09/05📉 1445.06→1444.44(-0.63), broadly flat
U.S. trade rates rebounded, while European rates remained weak.
The Premier Alliance — ONE, HMM, and Yang Ming — suspended its PS5 U.S. West Coast service only four months after launch due to weak demand, reflecting declining cargo volumes and persistent uncertainty across the U.S.–China trade.
2025/08/29📈 1415.36→1445.06(+29.7), up 2.1% from the previous week
The SCFI recorded a temporary rebound, but the sustainability of the recovery remained uncertain due to weakening demand.
Some carriers were redeploying vessels and restructuring services to avoid U.S. port fees on Chinese-built or Chinese-operated vessels scheduled to take effect in mid-October.
2025/08/22📉 1460.19→1415.36(-44.82), down 3.1% from the previous week
Market weakness continued amid a supply-demand imbalance, with some spot freight rates recently falling below contracted rate levels.
New vessel orders reached 2.43 million TEU through July, pushing the orderbook-to-fleet ratio close to 30.4%. An additional 600,000 TEU of vessel capacity was scheduled for delivery during the second half of the year, suggesting that supply pressure would persist across major trades throughout the remainder of the year.
2025/08/15📉 SCFI 1489.68→1460.19(-29.49), down 2.0% from the previous week
Freight rates on the U.S. trades fell to their lowest levels since December 2023 as the effects of tariff reductions and front-loading demand were exhausted.
The National Retail Federation forecast second-half U.S. imports at approximately 2.2 million TEU in August, down 5% year-on-year, followed by declines of 19.4% in September and 18.7% in October. November imports were projected at approximately 1.71 million TEU, down 20.8% year-on-year and the lowest monthly level since April 2023.
The eurozone economy grew only 0.4% quarter-on-quarter in the second quarter, while German factory orders declined for a second consecutive month, indicating slowing economic momentum.
2025/08/11📣 President Trump decided to extend the tariff truce with China by another 90 days.
2025/08/08📉SCFI 1550.74→1489.68(-61.06), down 3.9% from the previous week
Growing uncertainty surrounding U.S. tariffs on Chinese goods weakened demand on the North American trades.
With the tariff suspension scheduled to expire on August 12, the impact on freight rates was expected to depend heavily on the outcome of subsequent trade negotiations.
2025/08/01📉SCFI 1592.59→1550.74(-41.84), down 2.6% from the previous week
Efforts by companies to secure inventories ahead of changes in tariff policies had supported a short-term rise in freight rates during the second quarter.
However, as the results of country-by-country trade negotiations were announced, more importers adopted a wait-and-see approach.
Given that tariff levels remained higher than in the past, some small and medium-sized businesses were even considering abandoning imports altogether, increasing the possibility of an early end to the peak season due to weaker demand.
2025/07/25📉SCFI 1646.9→1592.59(-54.31), down 3.3% from the previous week
Despite a series of announced trade agreements, the demand outlook for the second half of the year remained weak.
Higher tariff levels compared with the past were creating additional burdens for smaller businesses and consumers, and second-half container volumes were expected to decline year-on-year.
Despite renewed attacks by Houthi forces in the Red Sea, CMA CGM decided to resume Suez Canal transits. Other carriers remained cautious about using the canal, and given prevailing market conditions, a broad return to the Suez route appeared unlikely during the second half of the year.
2025/07/18📉SCFI 1733.29→1646.9(-86.39), down 5.0% from the previous week
New tariffs on countries other than China were scheduled to take effect on August 1, reducing the benefit of the previous tariff suspension and placing downward pressure on freight rates.
Vessel utilization on the U.S. trades was running at approximately 80–90% in July, prompting rapid capacity reductions through service suspensions and blank sailings.
Demand was expected to weaken further from late July as the current wave of China–U.S. West Coast shipments came to an end, with carriers expected to expand capacity-management measures in August.
2025/07/11📉SCFI 1763.49→1733.29(-30.2), down 1.7% from the previous week
Since April, the North American trades had repeatedly moved through a cycle of demand changes → capacity adjustments → freight-rate reactions → further capacity adjustments in response to U.S. tariff policy announcements.
The number of U.S. West Coast services increased from 46 in May to 54 in June and July, before being scheduled to decline to 51 in August.
Some newly entered smaller carriers were expected to withdraw from the market earlier than planned, while total August capacity was projected to decline by 6.2% compared with July.
2025/07/04📉SCFI 1861.51→1763.49(-98.02), down 5.3% from the previous week
North American capacity reached approximately 1.57 million TEU in July, the highest level since the pandemic.
Weekly capacity on the U.S. West Coast trade increased by 10.1% compared with June, intensifying downward pressure on freight rates due to excess supply.
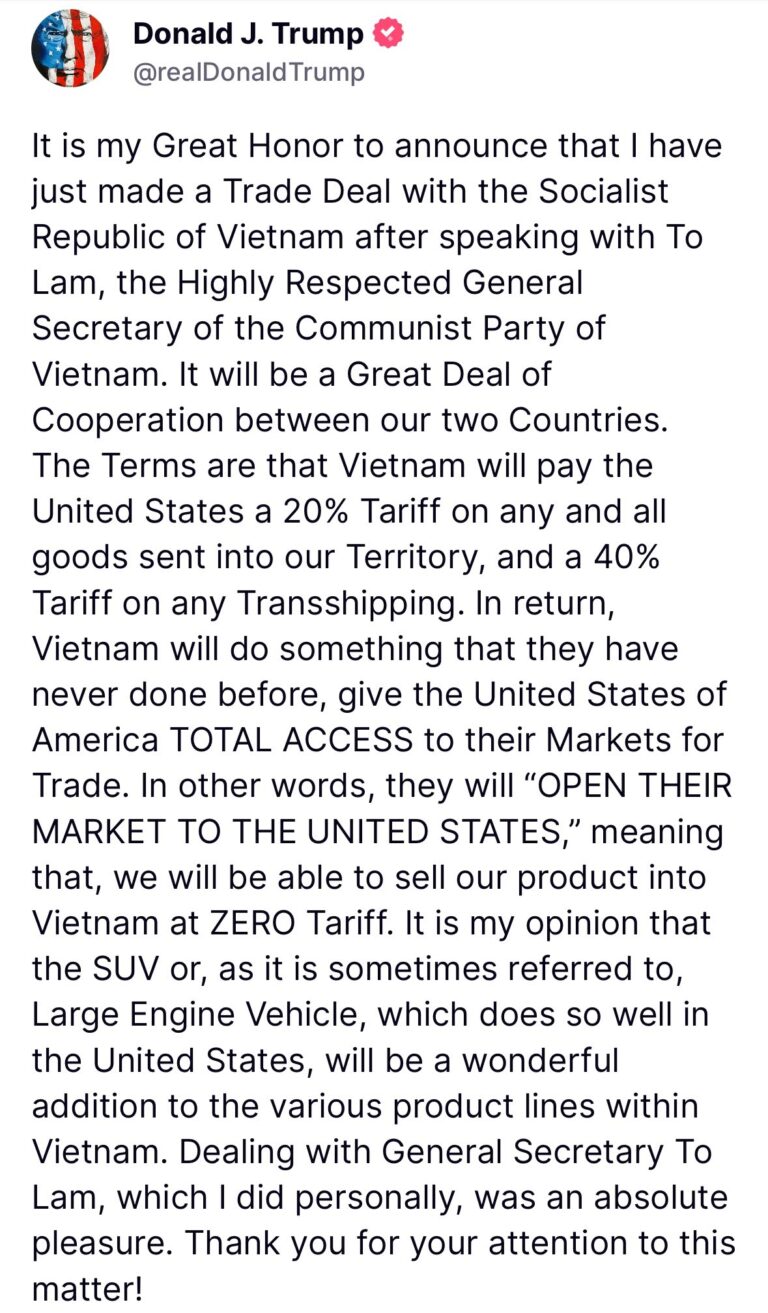
2025/07/02📣The United States and Vietnam announced a trade agreement:
– A 20% tariff on all Vietnamese exports to the United States
– A 40% tariff on goods transshipped through Vietnam
– Zero tariffs on U.S. imports into Vietnam
2025/06/27SCFI 1869.59→1861.51(-8.08) 전주 대비 -0.4%약보합세 📉
5월 한달간 미주 노선에 약 60만TEU가 추가 배치되면서 주간공급량은 평시 대비 15% 증가한 반면, 7월 관세 유예 종료를 앞두고 전반적인 물동량 약세가 나타나며 운임 약세 계속
2025/06/27📉SCFI 1869.59→1861.51(-8.08), down 0.4% from the previous week
Approximately 600,000 TEU of additional capacity was deployed on U.S. services during May, increasing weekly capacity by around 15% above normal levels.
Meanwhile, overall cargo demand weakened ahead of the expiration of the tariff suspension in July, keeping freight rates under pressure.
2025/06/20📉SCFI 2088.24→1869.59(-218.66), down 10.5% from the previous week
The short-term surge in freight rates, which had not been accompanied by a recovery in economic activity or consumer demand, quickly reversed as vessel capacity increased.
Following the U.S.–China tariff suspension agreement in May, the U.S. trades moved through a pattern of short-term rate surge → capacity increase → oversupply → sharp rate decline.
Although vessel supply expanded significantly, actual shipping bookings remained below late-May levels. Competition among carriers therefore intensified, accelerating the decline in freight rates.
2025/06/18📣 CMA CGM resumed vessel transit through the Suez Canal.
Suez Canal Authority 𝕏 Post
2025/06/13📉SCFI 2240.35→2088.24(-152.1), down 6.8% from the previous week
Following the U.S.–China tariff suspension agreement in May, carriers launched new U.S. West Coast services and concentrated additional capacity into the market.
As demand failed to keep pace with the increase in supply, bookings weakened in early June. Carriers subsequently withdrew planned GRIs, leading to a sharp decline in U.S. West Coast freight rates.
2025/06/06📈SCFI 2072.71→2240.35(+167.64), up 8.1% from the previous week
The recent surge in freight rates continued to trigger vessel redeployment toward the U.S. trades.
By July, capacity on the U.S. West Coast trade was expected to reach historically high levels.
2025/05/30📈SCFI 1586.12→2072.71(+486.59), up 30.7% from the previous week
With vessel capacity on the U.S. trades already reduced, demand surged following the U.S.–China tariff suspension agreement.
As a result, freight rates were expected to remain exceptionally strong through June.
2025/05/12📣 The United States and China reached an agreement on a temporary suspension of tariffs.